The Hidden Worlds of the Klein Tools TI250 Thermal Imager
There comes a time in every hobbyist’s life when they find themselves in need of a good thermal imaging camera. Most of us would probably follow the same workflow to pick one out: Visit any online retailer, search for “thermal camera” and sort by lowest price. If you do that on certain websites, you’ll find pages of results that look like kits somebody assembled at their kitchen table, followed by more results produced by companies with names that contain the wrong number of vowels. If you keep scrolling, you’ll eventually find the same first viable candidate that I did, the Klein Tools TI250 Rechargeable Thermal Imager.
Klein Tools is a manufacturer of hand tools for professional electricians, and they’ve been in that business for over a century and a half. Are they the best at it? Ehh, depends who you ask. Are they a real brand with a reputation to uphold? They sure are, especially compared to competitors like “Happlignly” (which was an honest-to-God result at the time of this writing). Klein isn’t really known for software engineering or hardware design, but I decided to give them a chance and see what it was all about.
Update (May 2023): After this article was initially published, the user mfincham posted a comment on Hacker News stating that the camera looks like a rebranded version of a product made by Uni-Trend (Uni-T). After looking a bit myself, I am convinced that the Klein Tools TI250 is essentially a Uni-T UTi120P in a different case, possibly with minor firmware changes.
Uni-T’s website offers “PC Software” for the UTi120P which purports to read the exact metadata I was trying to reverse-engineer here, and this likely explains why such data is embedded in the file to begin with. However, the files I tested were all misidentified as coming from a camera with a model number “WB-300” and this misidentification caused them to display improperly.
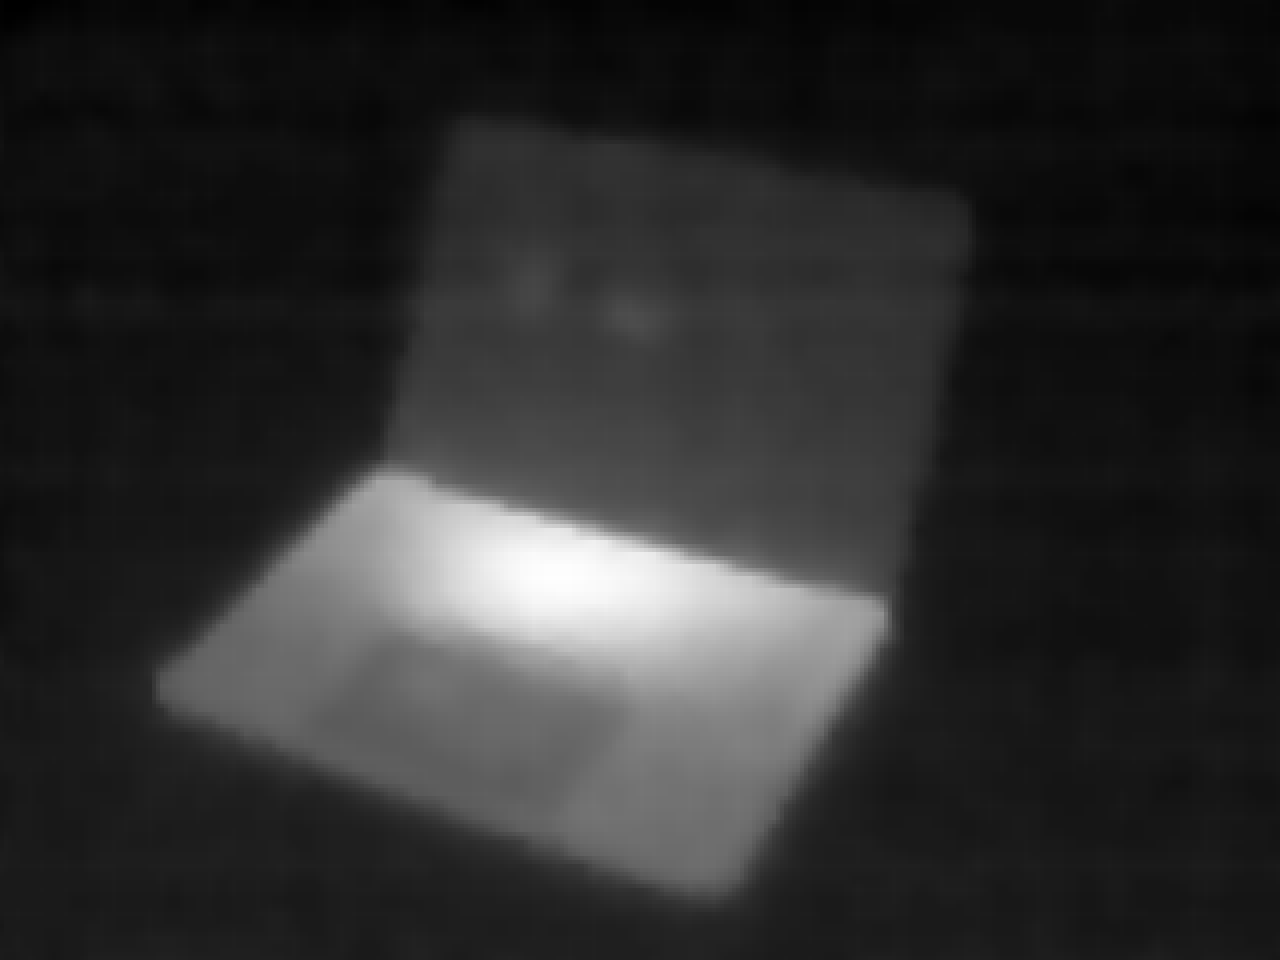
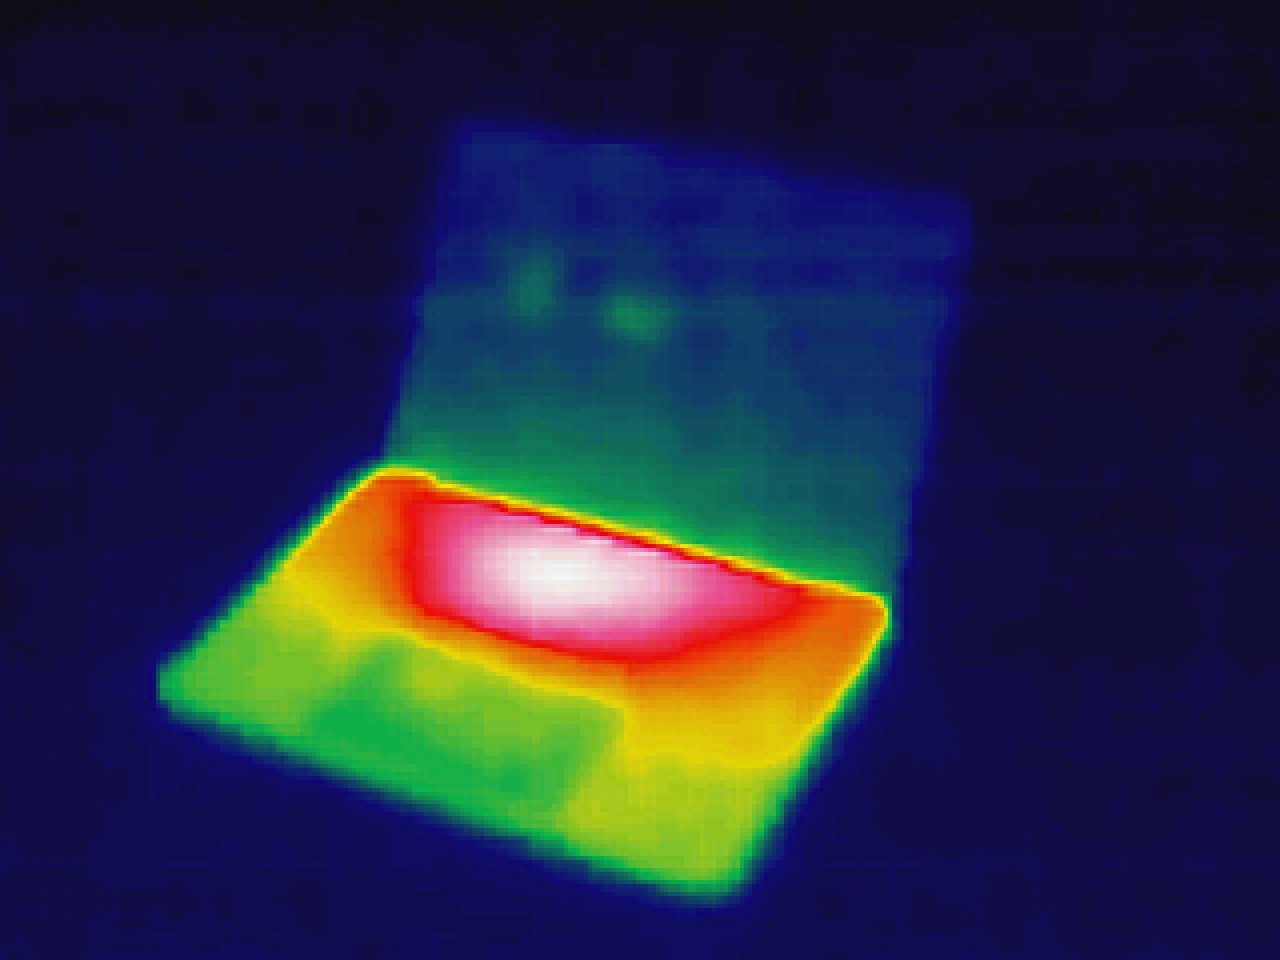
The TI250 can be had for $299, and boasts a few features I was specifically looking for. It’s a true thermal imager, which means it presents a two-dimensional picture of the temperature at every point in its field of view. Compare it to an image taken by a regular photographic camera:
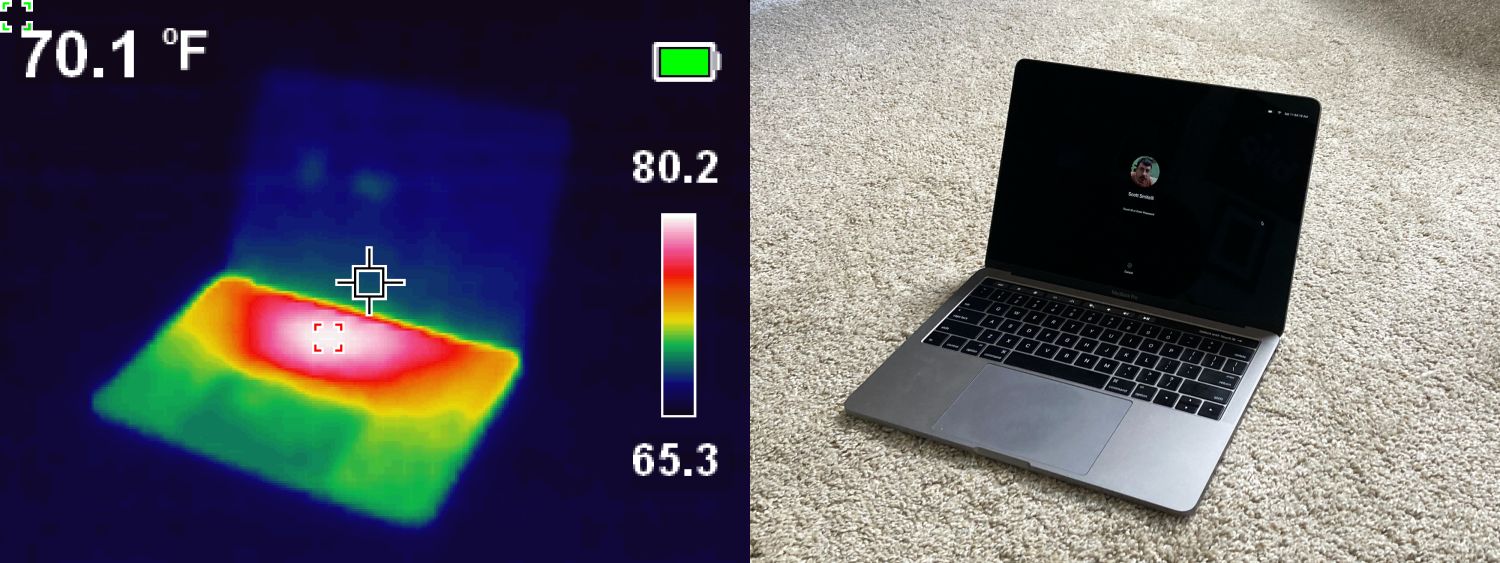
Thermal imaging vs. photographic imaging
The resolution of the screen is 320×240 pixels, although the specifications claim the thermal sensor has “over 10,000 pixels” on it. Dusting off my high school algebra, I’d wager a guess that the sensor is actually 120×90, or 10,800 pixels. These raw thermal pixels are upscaled to the 0.0768 megapixels presented to the user. The only real major inconvenience using it is the fact that it constantly pauses to calibrate itself to the temperature range it is being exposed to, a process that freezes the screen and UI for well over a second. If you don’t swing it around too much, it’s actually not so bad to deal with in practice.
One of the other features the TI250 has is the ability to save snapshots of the screen onto a microSD card. It’s this feature that ultimately sent me down a pretty deep rabbit hole.
Don’t be a cheapskate
When I first unpacked the unit, I grabbed the nearest unused microSD card and slapped it in there. A quick format, and then I had nothing but trouble. Snapshot requests would hang, pictures would not be saved, the playback menu was missing items, and images would randomly show as half-drawn or zero-byte files when plugged into a computer. In roughly ten attempts to take a picture, only one produced a complete usable file.
I was all set to write a scathing article about that, before I realized that I had grabbed such an old, cheap SD card that it did not have the Speed Class markings that most decent cards have nowadays. After swapping in a Class 4 microSD card, all those problems went away permanently. The old card apparently didn’t have sufficient write speed to keep up with what the TI250 was trying to do, and it made everything fall over.
Secret mode
While fighting with the aforementioned write issue, I stumbled on an interesting startup mode: 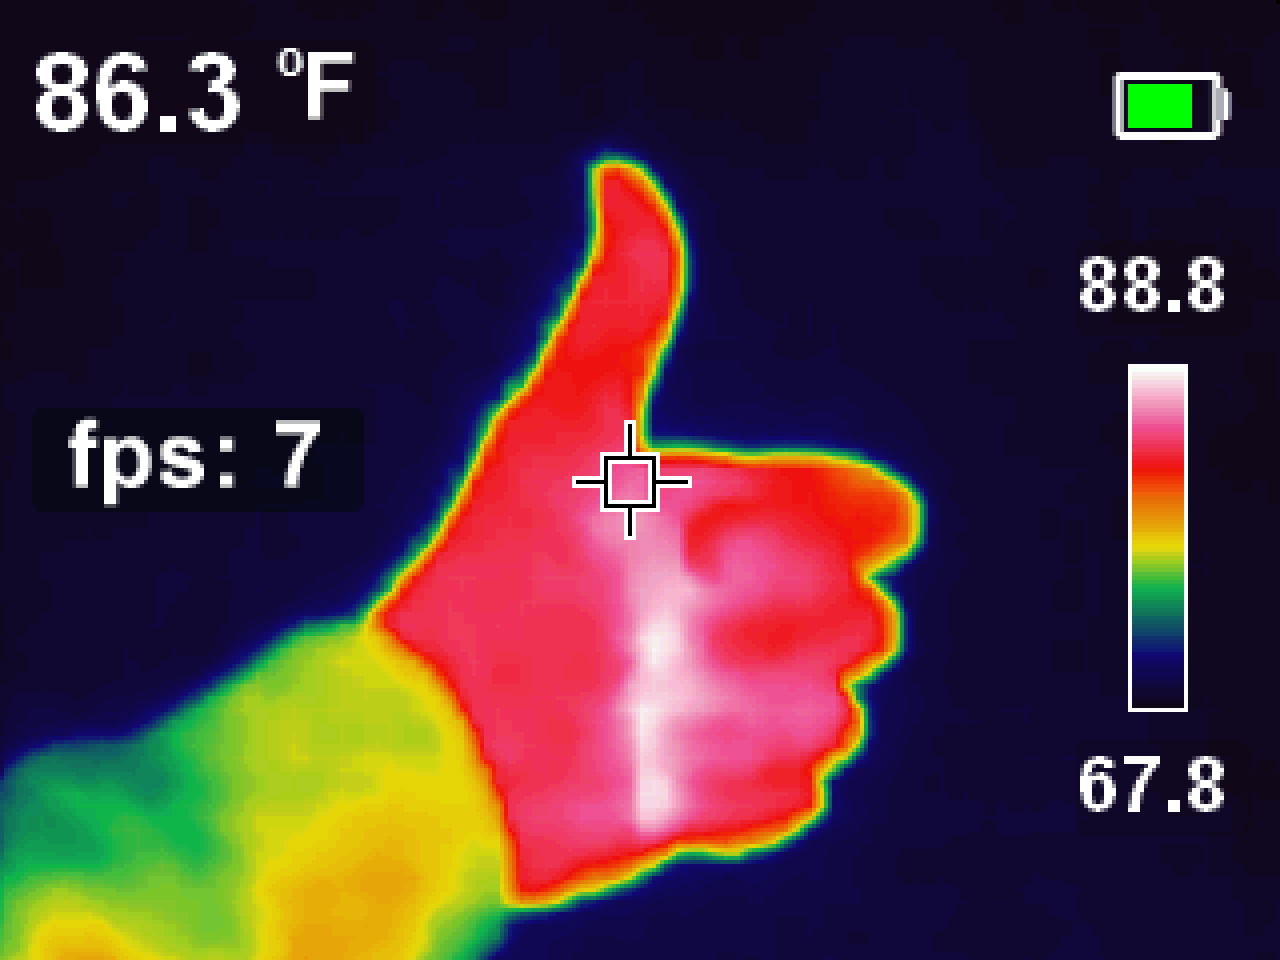
Collecting images
Okay, back to the saved pictures.
Once a number of image files have been saved on the microSD card, there are two ways to get them out. You can either plug the TI250 into a computer via USB (where it behaves as a removable disk) or you can plug the microSD card directly into a card reader. The end result is the same thing: You get a FAT32 volume containing an Images directory, and inside that is… a bunch of .bmp files. The images from the TI250 are saved as uncompressed bitmap images, with the date/time of capture encoded in the file name.
Now, since each of these images is only 320×240 with a 16-bit color depth, the amount of space used isn’t too bad… $ 320 \times 240 \times \frac{16}{8} = 150 $ KiB, plus a little extra for the bitmap header. No big deal.
Except all the images that come out of this thing are 225 KiB.
75 KiB of… what, exactly?
With computer memory measured in gigabytes and storage measured in terabytes, a 75 kibibyte difference is less than a rounding error’s rounding error. But here, it accounts for one third of the file. There’s something in here beyond the bitmap pixels that show on the screen. To the hex viewer mobile!
00000000: 424d 3658 0200 0000 0000 3600 0000 BM6X......6...
Every bitmap file starts with a rigidly defined 14-byte header structure. Like most things designed around descendants of the original IBM PC, all the values are little-endian. The bytes from this particular image have the following interpretation:
| Offset | Size | Description |
|---|---|---|
| 0x00 | 2 bytes | The bitmap identifier. Here it is the ASCII string “BM”, indicating a Windows 3.x/95/NT-style bitmap. |
| 0x02 | 4 bytes | The combined size of all headers and the pixel data, in bytes. Here the value decodes to 0x25836, or 153,654 decimal. |
| 0x06 | 2 bytes | Reserved, contains the value zero which has no defined meaning. |
| 0x08 | 2 bytes | Reserved, contains the value zero which has no defined meaning. |
| 0x0A | 4 bytes | The offset (relative to the beginning of the file) where the pixel data starts. Here the data starts at byte 0x36 (54 decimal) of the file. |
Okay, that’s 14 bytes read, but the pixel data doesn’t start for another 40 bytes. There’s another header in between:
0000000e:                                    2800                (.
00000010: 0000 4001 0000 f000 0000 0100 1000 0000  ..@.............
00000020: 0000 0000 0000 0000 0000 0000 0000 0000  ................
00000030: 0000 0000 0000                           ......
| Offset | Size | Description |
|---|---|---|
| 0x0E | 4 bytes | The size of this header, in bytes. Here the value is 0x28 (40 bytes), which is what we expected based on the values interpreted so far. Additionally, the value 40 implicitly declares this header is using the Windows BITMAPINFOHEADER format, which affects the interpretation of some of the subsequent fields. |
| 0x12 | 4 bytes | The pixel width of the image. Here 0x140, or 320 decimal. |
| 0x16 | 4 bytes | The pixel height of the image. Here 0xF0, or 240 decimal. |
| 0x1A | 2 bytes | The number of color planes. Should always be 1 (and it is). |
| 0x1C | 2 bytes | The number of bits per pixel. Here 0x10, or 16 decimal. This means each pixel should be encoded as a pair of two bytes, allowing for each pixel to have one of 65,536 different colors. |
| 0x1E | 4 bytes | The compression method. This file has a zero, indicating no compression is used. |
| 0x22 | 4 bytes | The image size if compression is used. This is an uncompressed image, so the value is zero. |
| 0x26 | 4 bytes | Optional horizontal resolution value, in pixels/meter. Left as zero here. |
| 0x2A | 4 bytes | Optional vertical resolution value, in pixels/meter. Left as zero here. |
| 0x2E | 4 bytes | The number of colors in the palette. By leaving this as zero, the value is computed automatically using the bits-per-pixel field. |
| 0x32 | 4 bytes | The number of “important” colors in the palette. Zero here; apparently nobody cares about this value. |
We’ve now parsed the entire header structure of the bitmap image, finding nothing unusual. There is a 14-byte header, followed by a 40-byte header, then 153,600 bytes of pixel data for a 320×240×16bpp uncompressed image. Everything in the front of the file is correct and self-corroborating. Whatever’s happening here, it’s happening in the back half of the file.
Out in the boondocks
Let’s jump to the 153,654th byte in the file, which should be the first byte outside of the known universe according to the bitmap header. In hex, this is around offset 0x25836:
00025810: 2408 2408 2408 2408 2408 2408 2408 2408  $.$.$.$.$.$.$.$.
00025820: 2408 2408 2308 2308 2308 2308 2308 2308  $.$.#.#.#.#.#.#.
00025830: 2308 2308 2308                           #.#.#.
========
00025836:                0000 0008 0808 0909 0909        ..........
00025840: 0909 0909 0a0b 0a0a 0a0a 0a0a 0909 0909  ................
00025850: 090a 0a0a 0b0b 0b0c 0c0c 0d0d 0d0d 0d0e  ................
00025860: 0f10 1113 181d 2227 2c31 3233 3537 393c  ......"',123579<
Oookay. The upper chunk of the hex view is the last 19 pixels of the image data. Each of these is either 0x824 or 0x823, which is sensible for our image. It’s essentially a horizontal span of pixels where everything is more or less the same color.
“Color” is kind of an interesting thing to mention here, but it becomes important now. Very briefly, screen colors are produced by varying levels of three “primary” colors: red, green, and blue. By mixing these three channels in different proportions, all colors can be reproduced. However, the astute may have noticed that we use 16 bits, or two bytes, to store the intensity values of three colors. These numbers don’t divide evenly, and indeed the channels are not encoded evenly either—red and blue are each given five bits for each pixel, and green gets six bits. There is a scientific basis to this, in that human eyes are more sensitive to variations in green colors than either red or blue. The bit packing for each pixel is then RRRR RGGG GGGB BBBB. Again, these are stored little-endian, so it’s practically impossible to intuit the visual appearance of colors by glancing at the hex view.
Unfortunately, once we fall off the end of the bitmap data, intuition is really all we have to go on. Let’s scroll.
00026920: 0c0c 0d0d 0d0e 0e0e 0f0f 0f0f 0f0f 0f0f  ................
00026930: 0f0f 0f0f 0f0f 0f0f 0f0f 1014 181d 2227  .............."'
00026940: 2d31 3539 3a3c 3e3f 4041 4243 4546 4748  -159:<>?@ABCEFGH
00026950: 494a 4b4c 4d4f 4f4f 5050 5050 5050 504f  IJKLMOOOPPPPPPPO
00026960: 4f4f 4f4f 5050 5050 4f4f 4f4e 4e4e 4d4d  OOOOPPPPOOONNNMM
00026970: 4d4c 4b4a 4a4a 4a49 4848 4747 4747 4748  MLKJJJJIHHGGGGGH
00026980: 4848 4848 4849 4848 4847 4646 4544 4444  HHHHHIHHHGFFEDDD
00026990: 4444 4343 433e 3934 3230 2e2d 2d2d 2d2d  DDCCC>9420.-----
000269a0: 2d2d 2d2e 2e2e 2f2f 2f30 3031 3232 3232  ---...///0012222
000269b0: 3232 3333 3334 3333 3333 3334 3434 3434  2233343333344444
000269c0: 3435 3433 3333 3334 3333 3332 3232 3232  4543333433322222
000269d0: 3232 3233 3333 3332 3131 3131 3232 3233  2223333211112223
000269e0: 3231 3130 3030 3030 3030 3031 3131 3131  2110000000011111
000269f0: 3131 302f 2f2e 2e2e 2d2d 2d2c 2c2c 2c2d  110//...---,,,,-
00026a00: 2e2e 2e2f 2f2f 2f30 310c 0c0c 0c0c 0c0c  ...////01.......
00026a10: 0c0c 0d0d 0d0e 0e0e 0f0f 0f0f 0f0f 0f0f  ................
00026a20: 0f0f 0f0f 0f0f 0f0f 0f10 1115 191e 2328  ..............#(
00026a30: 2d31 353a 3b3d 3f40 4142 4344 4546 4748  -15:;=?@ABCDEFGH
00026a40: 494a 4b4c 4d4e 4e4f 5050 5050 5050 504f  IJKLMNNOPPPPPPPO
00026a50: 4f4f 4f4f 4f4f 4f4f 4f4f 4f4e 4d4d 4c4b  OOOOOOOOOOONMMLK
00026a60: 4b4a 4949 4949 4948 4848 4747 4747 4748  KJIIIIIHHHGGGGGH
00026a70: 4848 4848 4849 4848 4847 4646 4544 4444  HHHHHIHHHGFFEDDD
00026a80: 4445 4444 4440 3c38 3532 2f2e 2d2d 2d2d  DEDDD@<852/.----
00026a90: 2d2d 2d2e 2e2e 2f2f 2f30 3031 3232 3232  ---...///0012222
00026aa0: 3232 3333 3334 3434 3434 3434 3434 3434  2233344444444444
00026ab0: 3435 3433 3333 3334 3333 3332 3232 3232  4543333433322222
00026ac0: 3232 3233 3333 3332 3131 3131 3232 3233  2223333211112223
00026ad0: 3231 3130 3030 3030 3030 3031 3131 3131  2110000000011111
00026ae0: 3131 302f 2f2e 2e2e 2d2d 2d2c 2c2c 2c2d  110//...---,,,,-
00026af0: 2e2e 2e2e 2e2e 2f2f 300c 0c0c 0c0c 0c0d  ......//0.......
It’s hard to show the full picture without boring everybody, but there’s a pattern in the ASCII view that repeats just about every 240 bytes. It’s obviously not an identical repetition of bytes each time, but it definitely has a repeating “shape” to it. This pattern continues for almost the entire remainder of the file. Thinking briefly, a 240-byte pattern fits into 75 KiB just about 320 times… I bet there’s another image here.
Obviously, this has to be an 8-bit image if it’s encoding 320×240 pixels in only 75 KiB of data. Typically 8-bit images are grayscale, with the byte value being applied uniformly to the red/green/blue channels. In this configuration, 0 would be black, 255 would be white, and anything in between would be a shade of gray. So let’s see what it looks like:
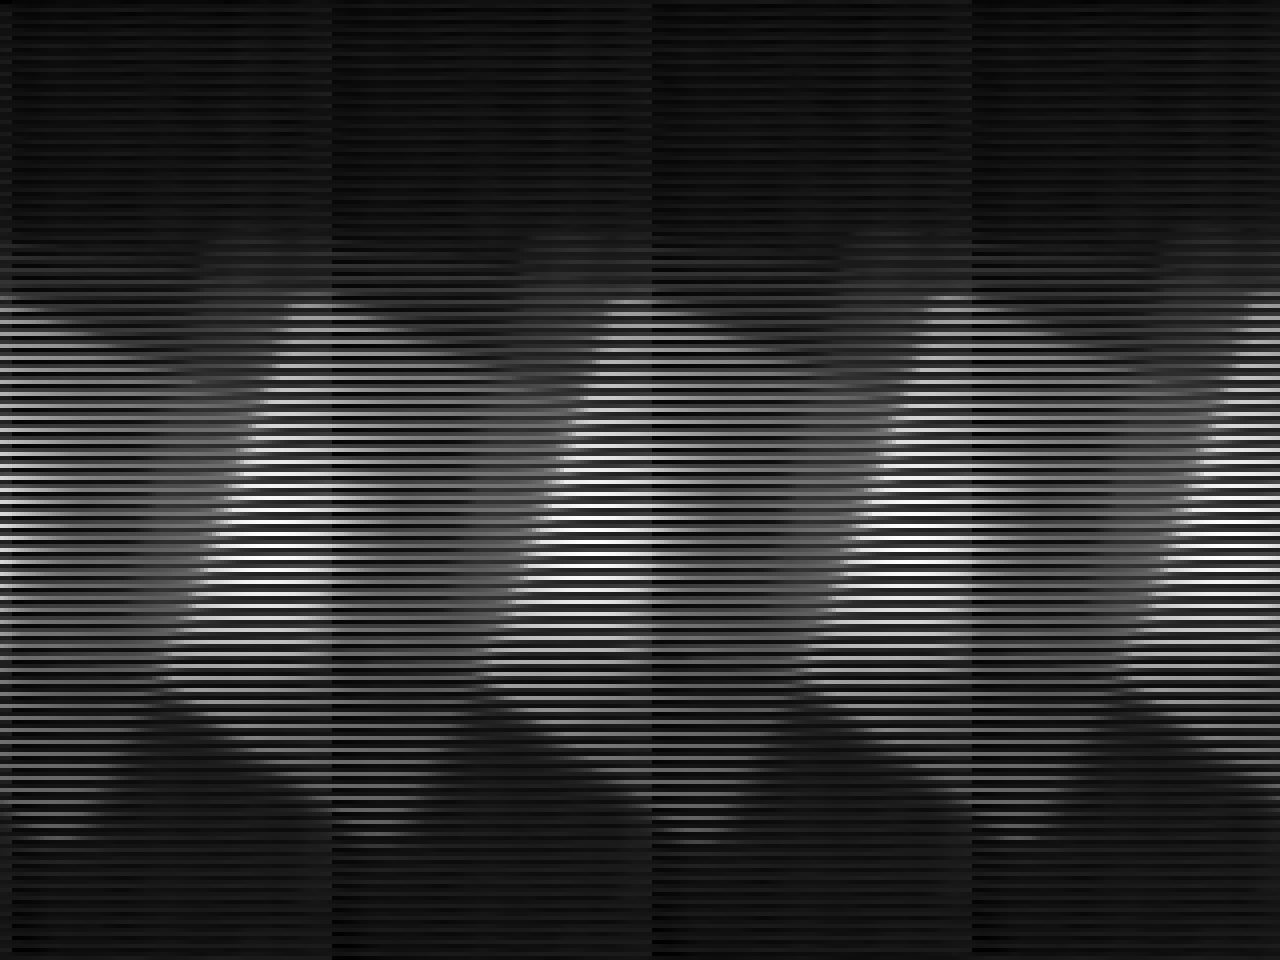
Extraction attempt #1
Hmm. Maybe it’s not a 320×240 image. Is it a 240×320 image?
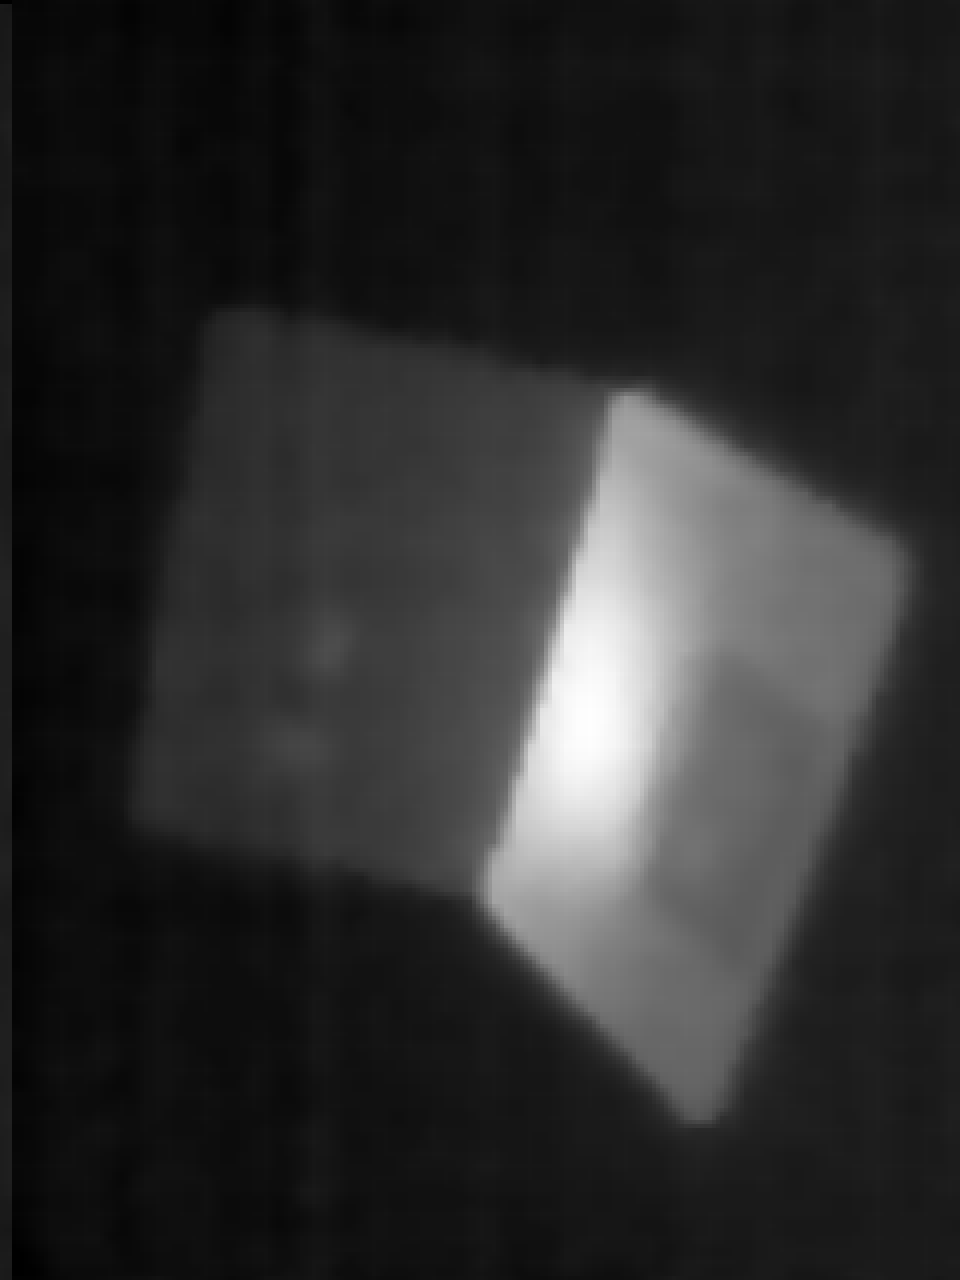
Extraction attempt #2
Indeed it is. Apparently the image data is stored in column-major order (compared to the row-major order that would typically be expected in raster images). What’s even more interesting is, this data does not have any of the overlays that are present in the bitmap image. This looks like the raw thermal data that came from the sensor without any of the coloring or overlay information added by the TI250’s firmware.
This image isn’t actually 100% correct—by looking closely, one might be able to tell that the left edge of the picture contains a discontinuity that’s three pixels wide. It looks like this data doesn’t actually start immediately after the end of the BMP image data. There are three null bytes separating the end of the bitmap from the start of the thermal data. By skipping over them, and rotating the image back to its correct orientation, the output looks good!
Extraction attempt #3
There are a few properties about the thermal data that seem to always hold true:
- The coldest part of the image always has value 0. The data is never biased away from zero.
- The hottest part of the image is usually 254, but sometimes can be quite a bit lower. It never seems to be 255.
- Even in highly-contrasted images, it appears as though every value between 0 and the highest value is used. That means if the high point in a given image has value 254, every value from 0 to 254 appears somewhere in that data. Even while taking some extremely contrived and stupid snapshots, I could not find an instance where this didn’t occur. This implies that there is some kind of smoothing or resampling involved in scaling the image from the sensor’s 120×90 to the saved 320×240 resolution.
A splash of color
So that explains 230,457 bytes of our 230,995 byte file. There are still 538 mystery bytes to investigate. We begin here:
00038439:                       63 1063 1063 1063           c.c.c.c
00038440: 1063 1064 1064 1064 1064 1065 1065 1065  .c.d.d.d.d.e.e.e
00038450: 1066 1066 1066 1066 1067 1067 1067 1067  .f.f.f.f.g.g.g.g
00038460: 1068 1068 1068 1069 1069 1069 1069 106a  .h.h.h.i.i.i.i.j
00038470: 106a 106a 106a 106b 106b 106b 106c 106c  .j.j.j.k.k.k.l.l
00038480: 106c 106c 106d 106d 106d 106e 106e 108e  .l.l.m.m.m.n.n..
00038490: 10ae 10ce 10ee 10ee 100e 112e 114e 116d  .............N.m
000384a0: 118d 118d 11ad 11cd 11ed 110d 120d 122d  ...............-
000384b0: 124d 126c 128c 12ac 12ac 12cc 12ec 120c  .M.l............
Once again, this looks like a pattern. The data seems to be arranged in two-byte pairs that are “gently” increasing. How high does it go?
00038610: f579 f599 f5b9 f5da f5fa f51a f63a f65b  .y...........:.[
00038620: f67b f69b f6bc f6dc f6fc f61c f73d f75d  .{...........=.]
00038630: f77d f79e f7be f7de f701 2301 8600 fe00  .}........#.....
It gets to 0xDE 0xF7 before snapping back down to 0x01. This happens exactly 0x200 bytes from where the pattern started. That implies there are 256 samples of 16-bit values here.
Could it be a palette? What happens if we decode each value to a color using the 5 red/6 green/5 blue bit packing used by the BMP format itself?

Rainbow palette
It’s our palette! This means that, if we wanted to, we could map the palette values onto the thermal data to reconstruct the colorized version of the image without the overlays.
Reconstructed color image from thermal data
This is the default “rainbow” palette. There are also user-selectable “Ironbow” and “Gray” (sometimes referred to as “white-hot”) palettes that can be extracted from other images…

Ironbow palette

Gray palette
…and those can be mapped onto the thermal data the same way:
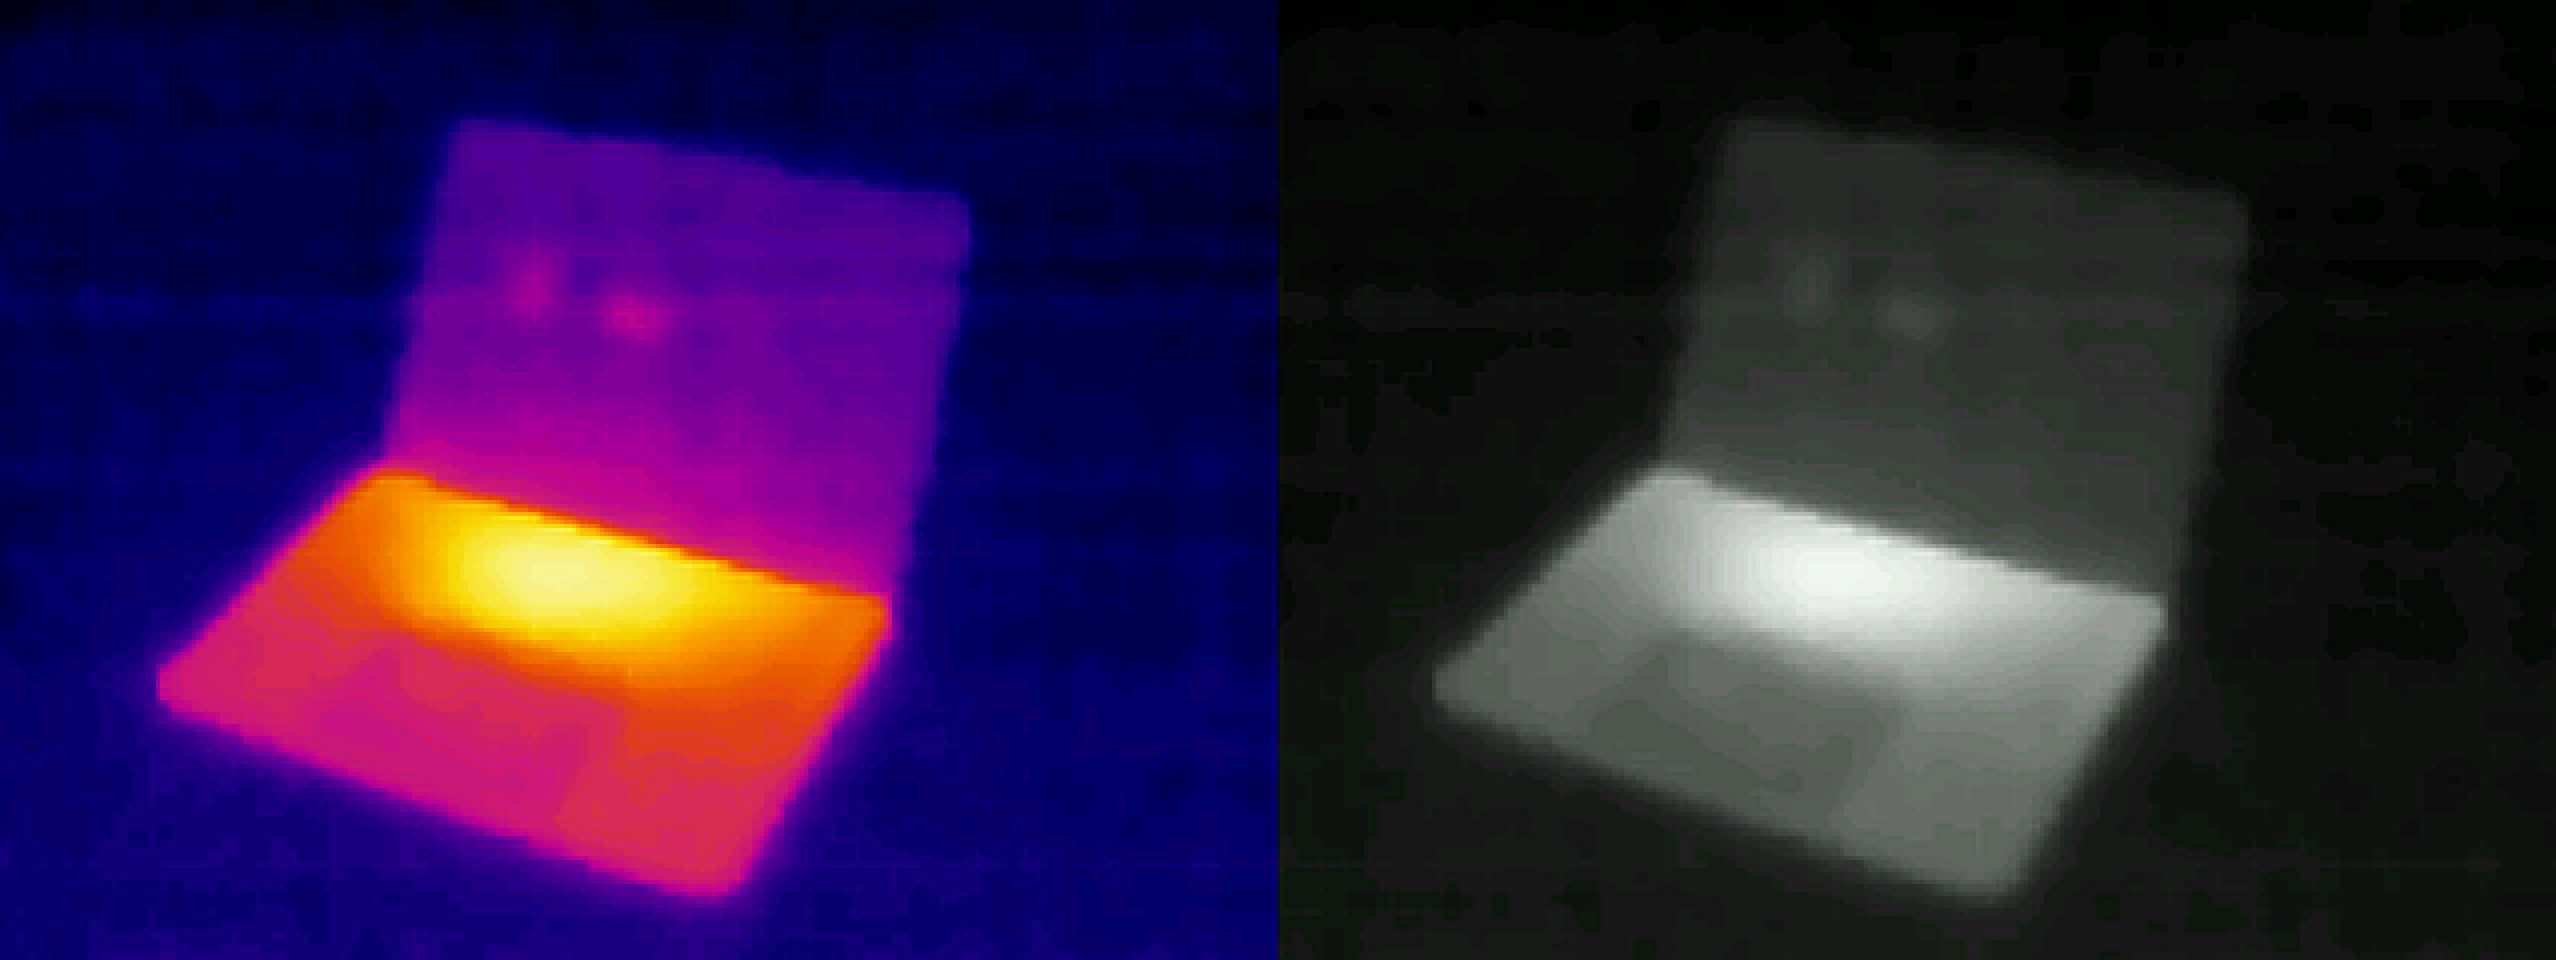
Reconstructed color image using different palettes
Very nice indeed. But if you’ve learned anything from reading this far, you know that there’s always more.
Last bytes standing
After all that, we still have 26 bytes at the end of the file that are unaccounted for:
00038639:                       01 2301 8600 fe00           .#.....
00038640: ee00 5f03 0000 0012 00a8 0087 008a 0000  .._.............
00038650: 0000 00                                  ...
I won’t go into a long account of how I determined the purpose of these values. Suffice it to say it took dozens of images, and flipping pretty much every setting in the UI to determine what changed each time.
| Offset | Size | Description |
|---|---|---|
| 0x00 | 1 byte | Temperature display preference (0 = Celsius, 1 = Fahrenheit) |
| 0x01 | 2 bytes | Scale high temperature (in tenths of degrees Celsius) |
| 0x03 | 2 bytes | Scale low temperature (in tenths of degrees Celsius) |
| 0x05 | 2 bytes | Highest value seen in the thermal data (0–254) |
| 0x07 | 2 bytes | Center temperature (in tenths of degrees Celsius) |
| 0x09 | 1 byte | Emissivity setting (in hundredths, 1–100) |
| 0x0A | 4 bytes | Padding/unknown purpose; always 3 |
| 0x0E | 2 bytes | Minimum temperature point along short axis |
| 0x10 | 2 bytes | Minimum temperature point along long axis |
| 0x12 | 2 bytes | Maximum temperature point along short axis |
| 0x14 | 2 bytes | Maximum temperature point along long axis |
| 0x16 | 4 bytes | Padding; always zero |
(All offsets in this table are relative to the start of the data area.)
Update (May 2023): The Uni-Trend “PC Software” (described earlier) displays a field that identifies the model of camera that captured the image. I suspect the unknown constant “3” is used for this purpose.
This data encodes, in a machine readable format, all of the information that is normally shown in text/icon overlays on the screen. Like the rest of the BMP format, all multibyte values are stored in little-endian order with the least significant bytes written first.
Temperatures are interesting, in that they are always stored in degrees Celsius (regardless of the user’s settings) scaled by a factor of 10 to keep tenths of degrees. A temperature of 70.5 °F would be encoded as 213 (21.3 °C with the decimal shifted one place to the right). Temperatures may be negative, expressed as two’s compliment values (so 0xFFB9 for -71, indicating -7.1 °C or 19.2 °F). The emissivity setting has a somewhat similar encoding, where a setting of 0.9 would be encoded as 90 (the decimal shifts two places to the right as this field has hundredths precision). This allows for storing numbers with a fixed fractional part while still keeping everything in integer form.
The scale high/low temperatures are the endpoints of the color scale, not necessarily the coldest and hottest temperatures sampled in the picture. As a concrete example, if the scale low/high temperatures are 60 °F and 80 °F respectively, but the highest value seen in the thermal data is only 128 (half of the overall scale available) the true temperature of the hottest point is around 70 °F. Visually, this would present itself as an image containing none of the “hot” colors from the upper half of the palette.
The minimum/maximum temperature points are encoded as a set of X,Y pairs interpreted in the coordinate space of the device’s sensor with 0,0 in its top-left corner. This essentially means that while the origin of the sensor is in the expected top-left position, the rotated screen space moves that origin to the top-right. To correctly interpret this data:
- Read the thermal data as a 240×320 image in row major order.
- Rotate that image 90 degrees clockwise, producing a 320×240 image in screen orientation.
- With the 0,0 origin at the screen’s top-RIGHT corner, and with increasing coordinate values moving down and to the left, plot the points normally.
Note: Be aware that sometimes the minimum/maximum point position might run off the left or bottom edges of the image by one or two pixels. I can’t tell you why it does that.
Overall file structure
The TL;DR of this is, there’s more to the TI250’s bitmap files than simply a bitmap image. The structure of the file as a whole is:
| Offset | Size | Description |
|---|---|---|
| 0x00000 | 14 bytes | BMP file header |
| 0x0000E | 40 bytes | Extended BITMAPINFOHEADER header |
| 0x00036 | 153,600 bytes | 320×240 16bpp uncompressed bitmap image data |
| 0x25836 | 3 bytes | Null padding; start of data beyond what a standard BMP loader will read |
| 0x25839 | 76,800 bytes | 240×320 8bpp thermal image data |
| 0x38439 | 512 bytes | 256 color palette table entries, in the same 16bpp encoding as the bitmap image data |
| 0x38639 | 26 bytes | Measurement metadata (see previous table for fields) |
This is probably meant for some sort of analysis software, possibly to provide the necessary reference information to rescale and normalize images once they have been taken. I’m not aware of any official or unofficial software that supports doing this for the TI250, but hopefully this information will be of use to anybody who wants to explore that space.
Update (May 2023): There is software that reads this kind of metadata: It’s called the “PC Software” from Uni-T’s website. This software is capable of reading metadata and using it to perform analysis on images captured by the UTi120P, but during my testing I have had almost no success in getting it to properly handle images from the TI250.
Borrow my tools
I put together a relatively small Python program that parses a TI250 image file, prints a summary, and optionally regenerates a new variant of the image from the thermal data and a palette. The source is in this GitHub gist. For those who are mainly interested in a reference implementation of a TI250 data parser, almost all of that is in the load() method.
In its most basic form, the tool will read the file, print the embedded metadata, and sanity-check the data for internal consistency:
$ python3 ti250tool.py /path/to/some/ti250/image.bmp
Input filename:         /path/to/some/ti250/image.bmp
Date from filename:     2022-04-09 11:58:00
Image dimensions:       320x240
Detected palette:       ironbow (256 entries)
Display units:          Fahrenheit
Temperature scale:      47.1 F - 84.5 F
Center temperature:     75.9 F
Highest thermal value:  254
Emissivity:             0.95
Min temperature point:  (81, 231)
Max temperature point:  (126, 63)
Sanity check passed!
Use -s / --skip-sanity to skip the sanity checks if they fail. (Please send me a copy of any image that fails a sanity check so I can figure out what I missed!)
Add -o OUT_FILE / --out-file OUT_FILE to generate a new image based on the thermal data and stored palette data, without any UI overlay information. The output image format is selected based on the file extension provided in OUT_FILE (.png, .jpg, and .bmp are all fine choices; anything PIL supports on your system should work).
To ignore the stored palette data and force the output file to be drawn in a different palette, add -f / --force-palette followed by one of gray, ironbow, or rainbow.
To bypass the palette entirely and output the raw thermal samples directly, use -r / --raw-output.
To add a blue marker at the minimum temperature point, and/or a red marker at the maximum temperature point, pass -n / --draw-min and/or -x / --draw-max, respectively.
Some combinations of these options don’t make sense and will not be honored. You’ll figure it out.
« Back to Articles